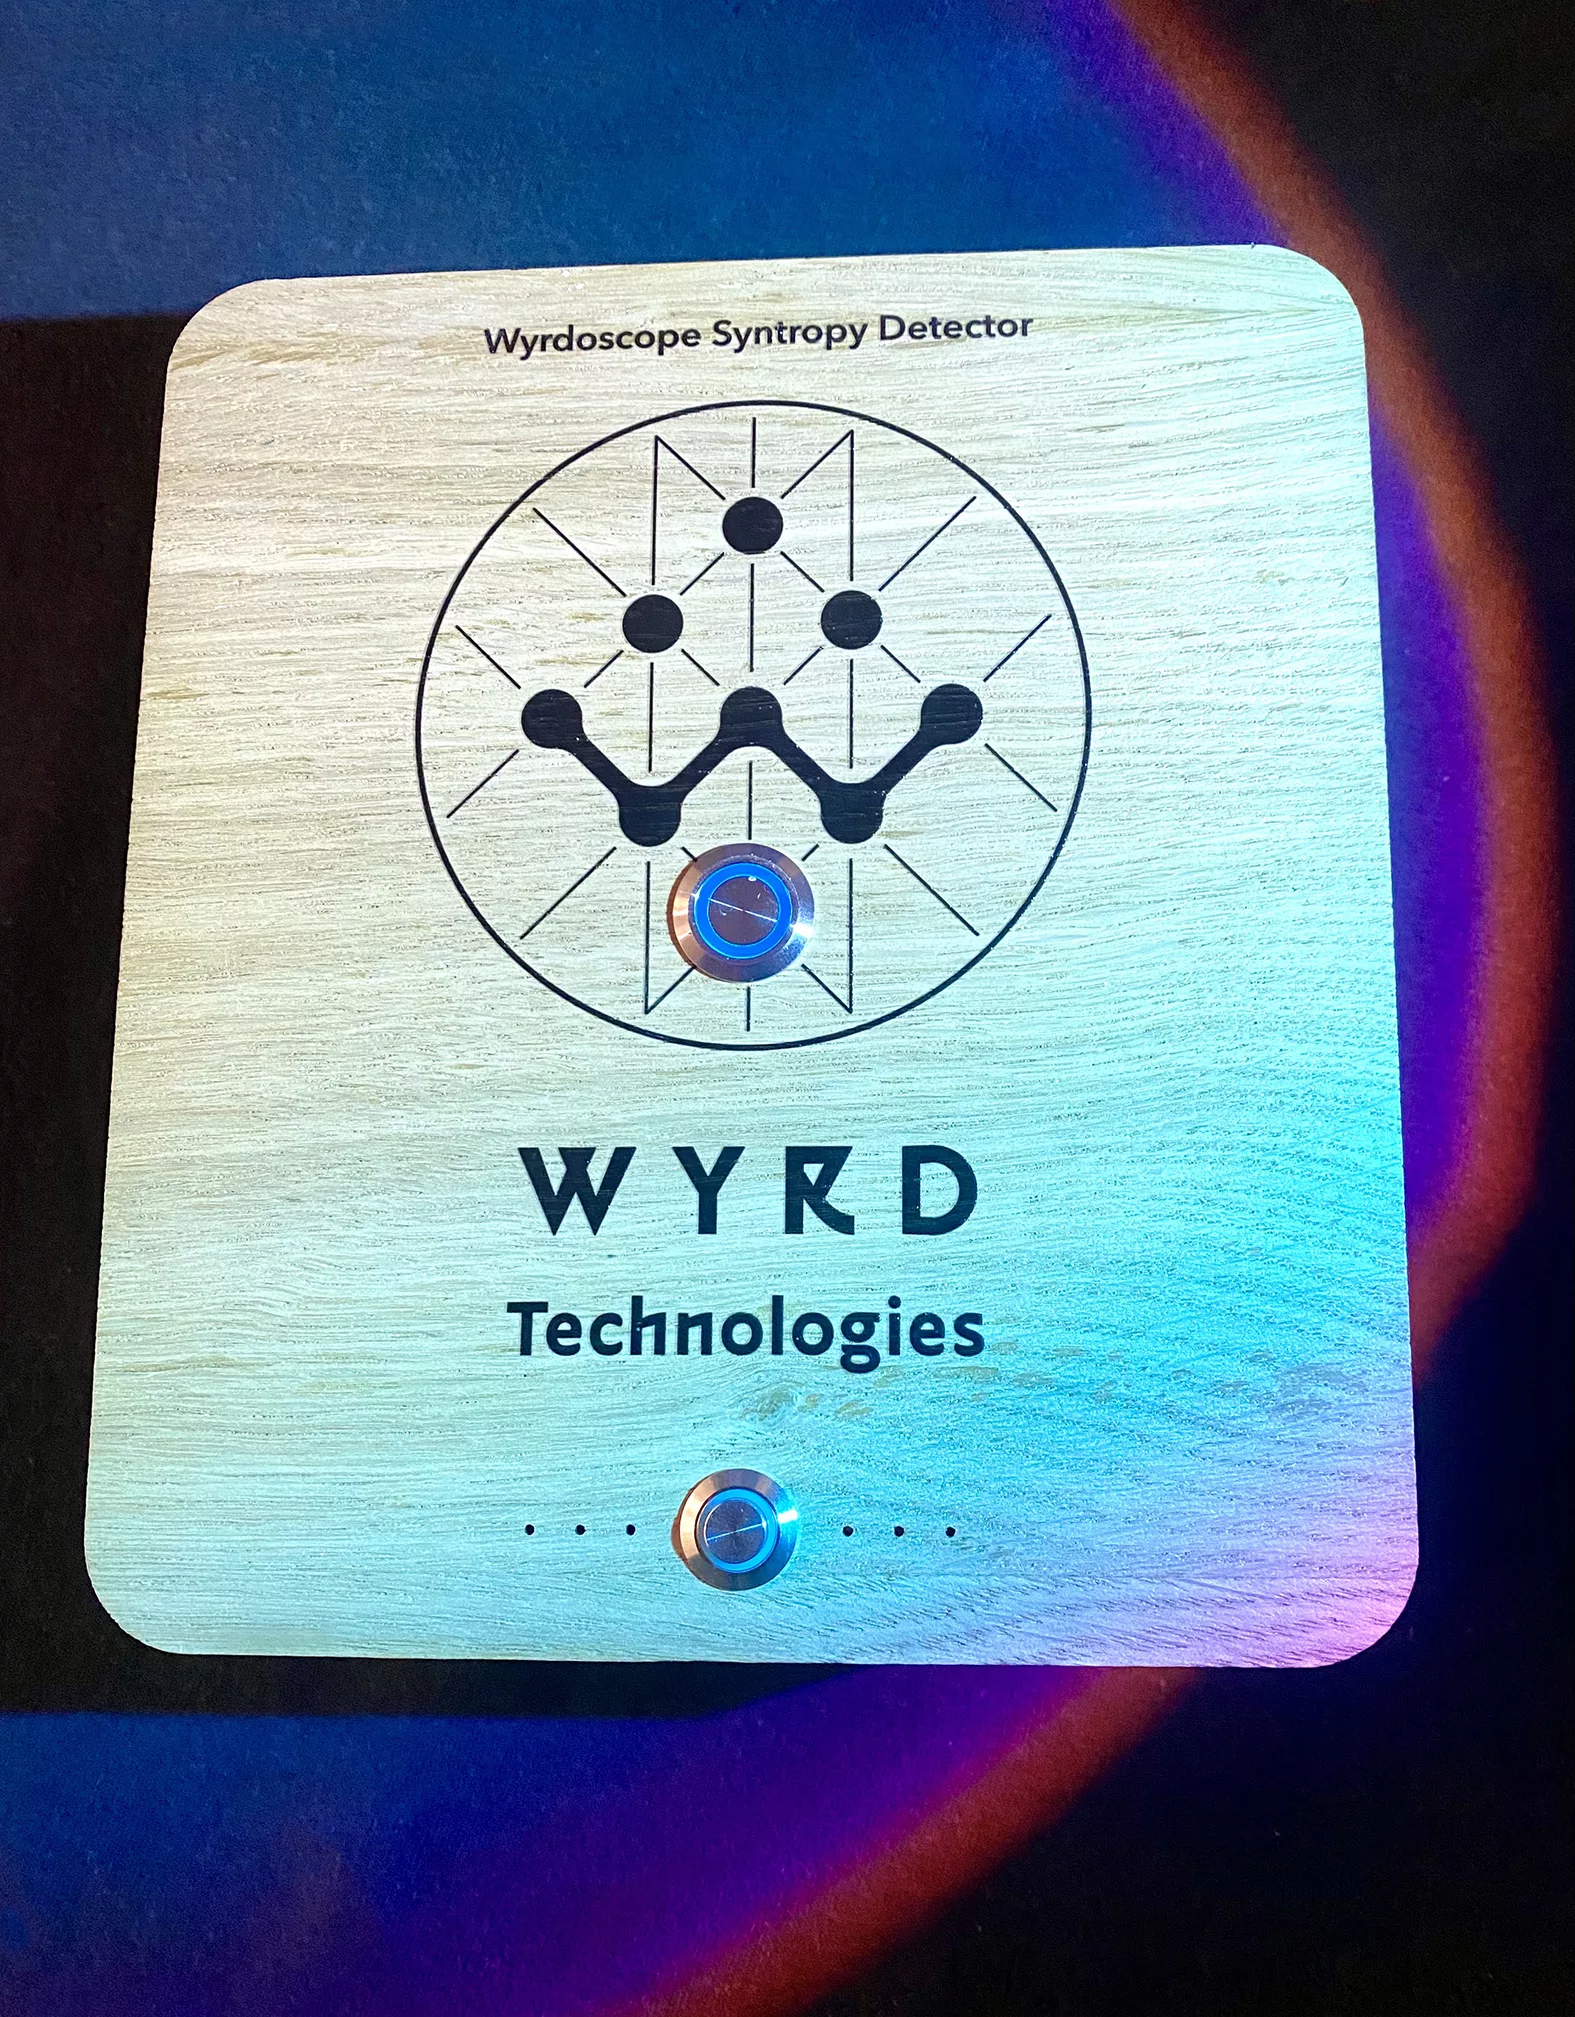
Between the 19th and 23rd of November 2023 we ran our annual Science and Consciousness event at the Broughton Sanctuary in Yorkshire, UK. During the event we were running a Wyrdoscope Syntropy Detector to track the developments in the collective field of consciousness during the event (if this is not a familiar concept, see the links at the bottom of the article). This post describes some of the events registered in “the field” and how they matched what we all experienced on the ground.
How does the Wyrdoscope work?
The Wyrdoscope contains two random event generators (REGs) which are generating lots of 1’s and 0’s using a quantum tunnelling effect. According to mainstream physics, nothing should be able to influence them and they should average out in a random distribution. However, as initially demonstrated during 28 years of research at the Princeton Engineering Anomalies Research Lab (PEAR), it turns out that people’s intentions and our collective experience, do indeed effect these devices in a statistically significant way.
The uniqueness of the Wyrdoscope compared to the original PEAR devices is the combination of two REGs and the software that compares the data streams of the devices and looks for patterns that deviate from what should be random behaviour. It looks at data from 5 different channels. That increases the data available to analyse and provides a more accurate way of identifying patterns in the data.
What did we find during Science and Consciousness 2023?
Dream Group
Every day of the event a group gathered in the mornings to review their participation in dream experiments. The peak on the chart below coincides with the start of the dream group on Tuesday 21st. The likelihood of this data occurring by chance is 1 in 1500.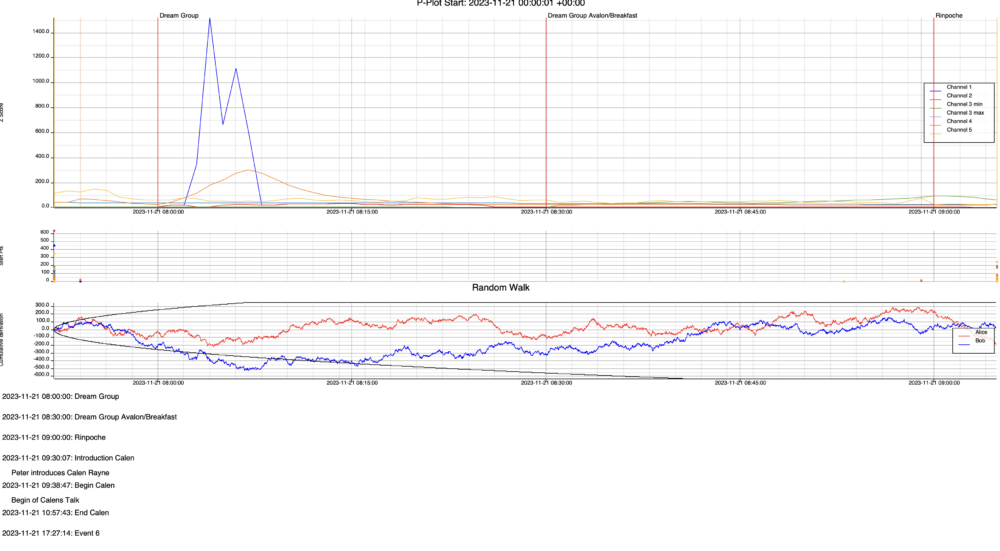
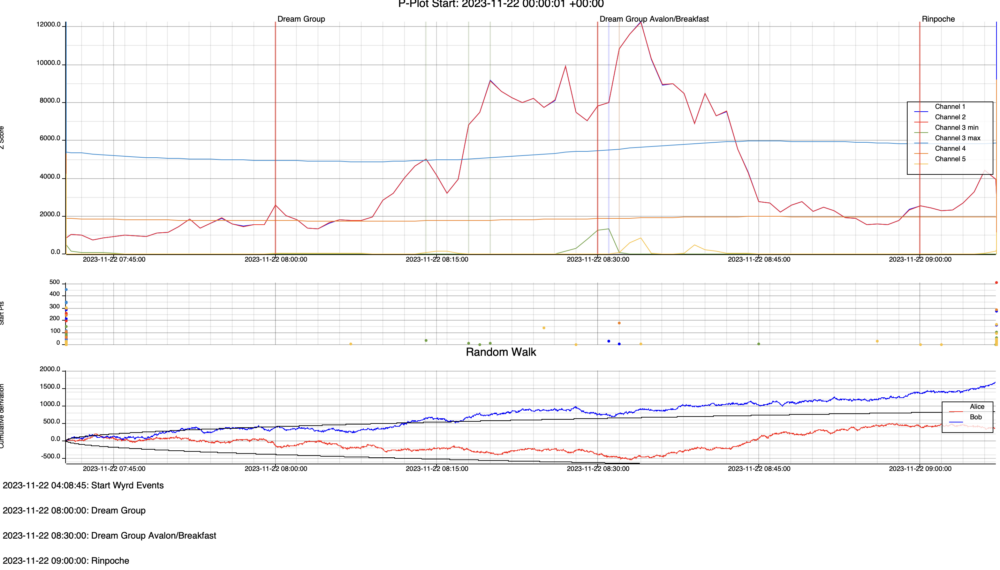
This chart below is the dream group on the morning of Wednesday 22nd with a likelihood of this data occurring by chance is 1 in 12,000:
Morning Meditations with HH Khedrupchen Rinpoche
We started each day together at 09.00 with a meditation lead by His Holiness Kedrupchen Rinpoche. Many people reported a deepening of their experience with each day.
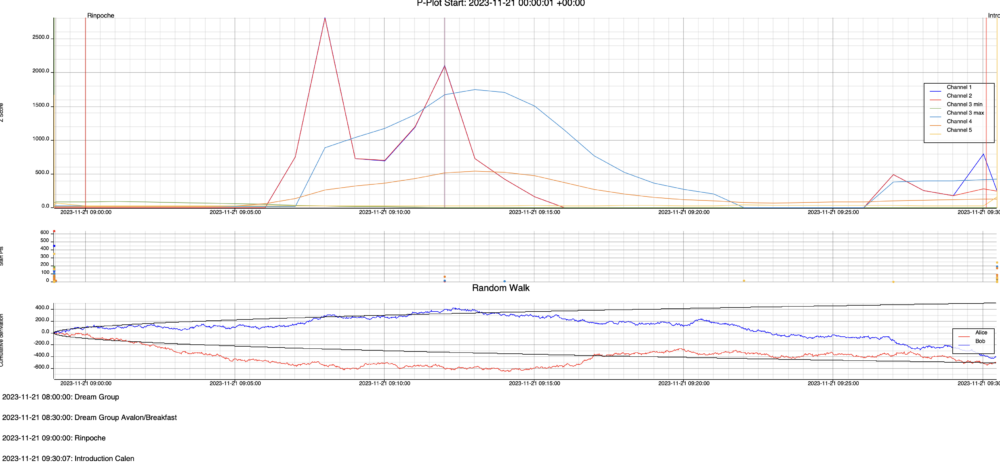
This chart from Tuesday 21st shows a significant peak during the meditation with a likelihood of this data occurring by chance of 1 in 2700. Note that 3 different channels all identify a deviance from what would be expected.
This chart below is the meditation with the Rinpoche on Wednesday 22nd and the start of Donna Thomas’ talk straight afterwards. You can clearly see where one event closes and the next one starts (between the blue peaks on the left). The likelihood for these peak events occurring by chance has now risen to 1 in 90,000.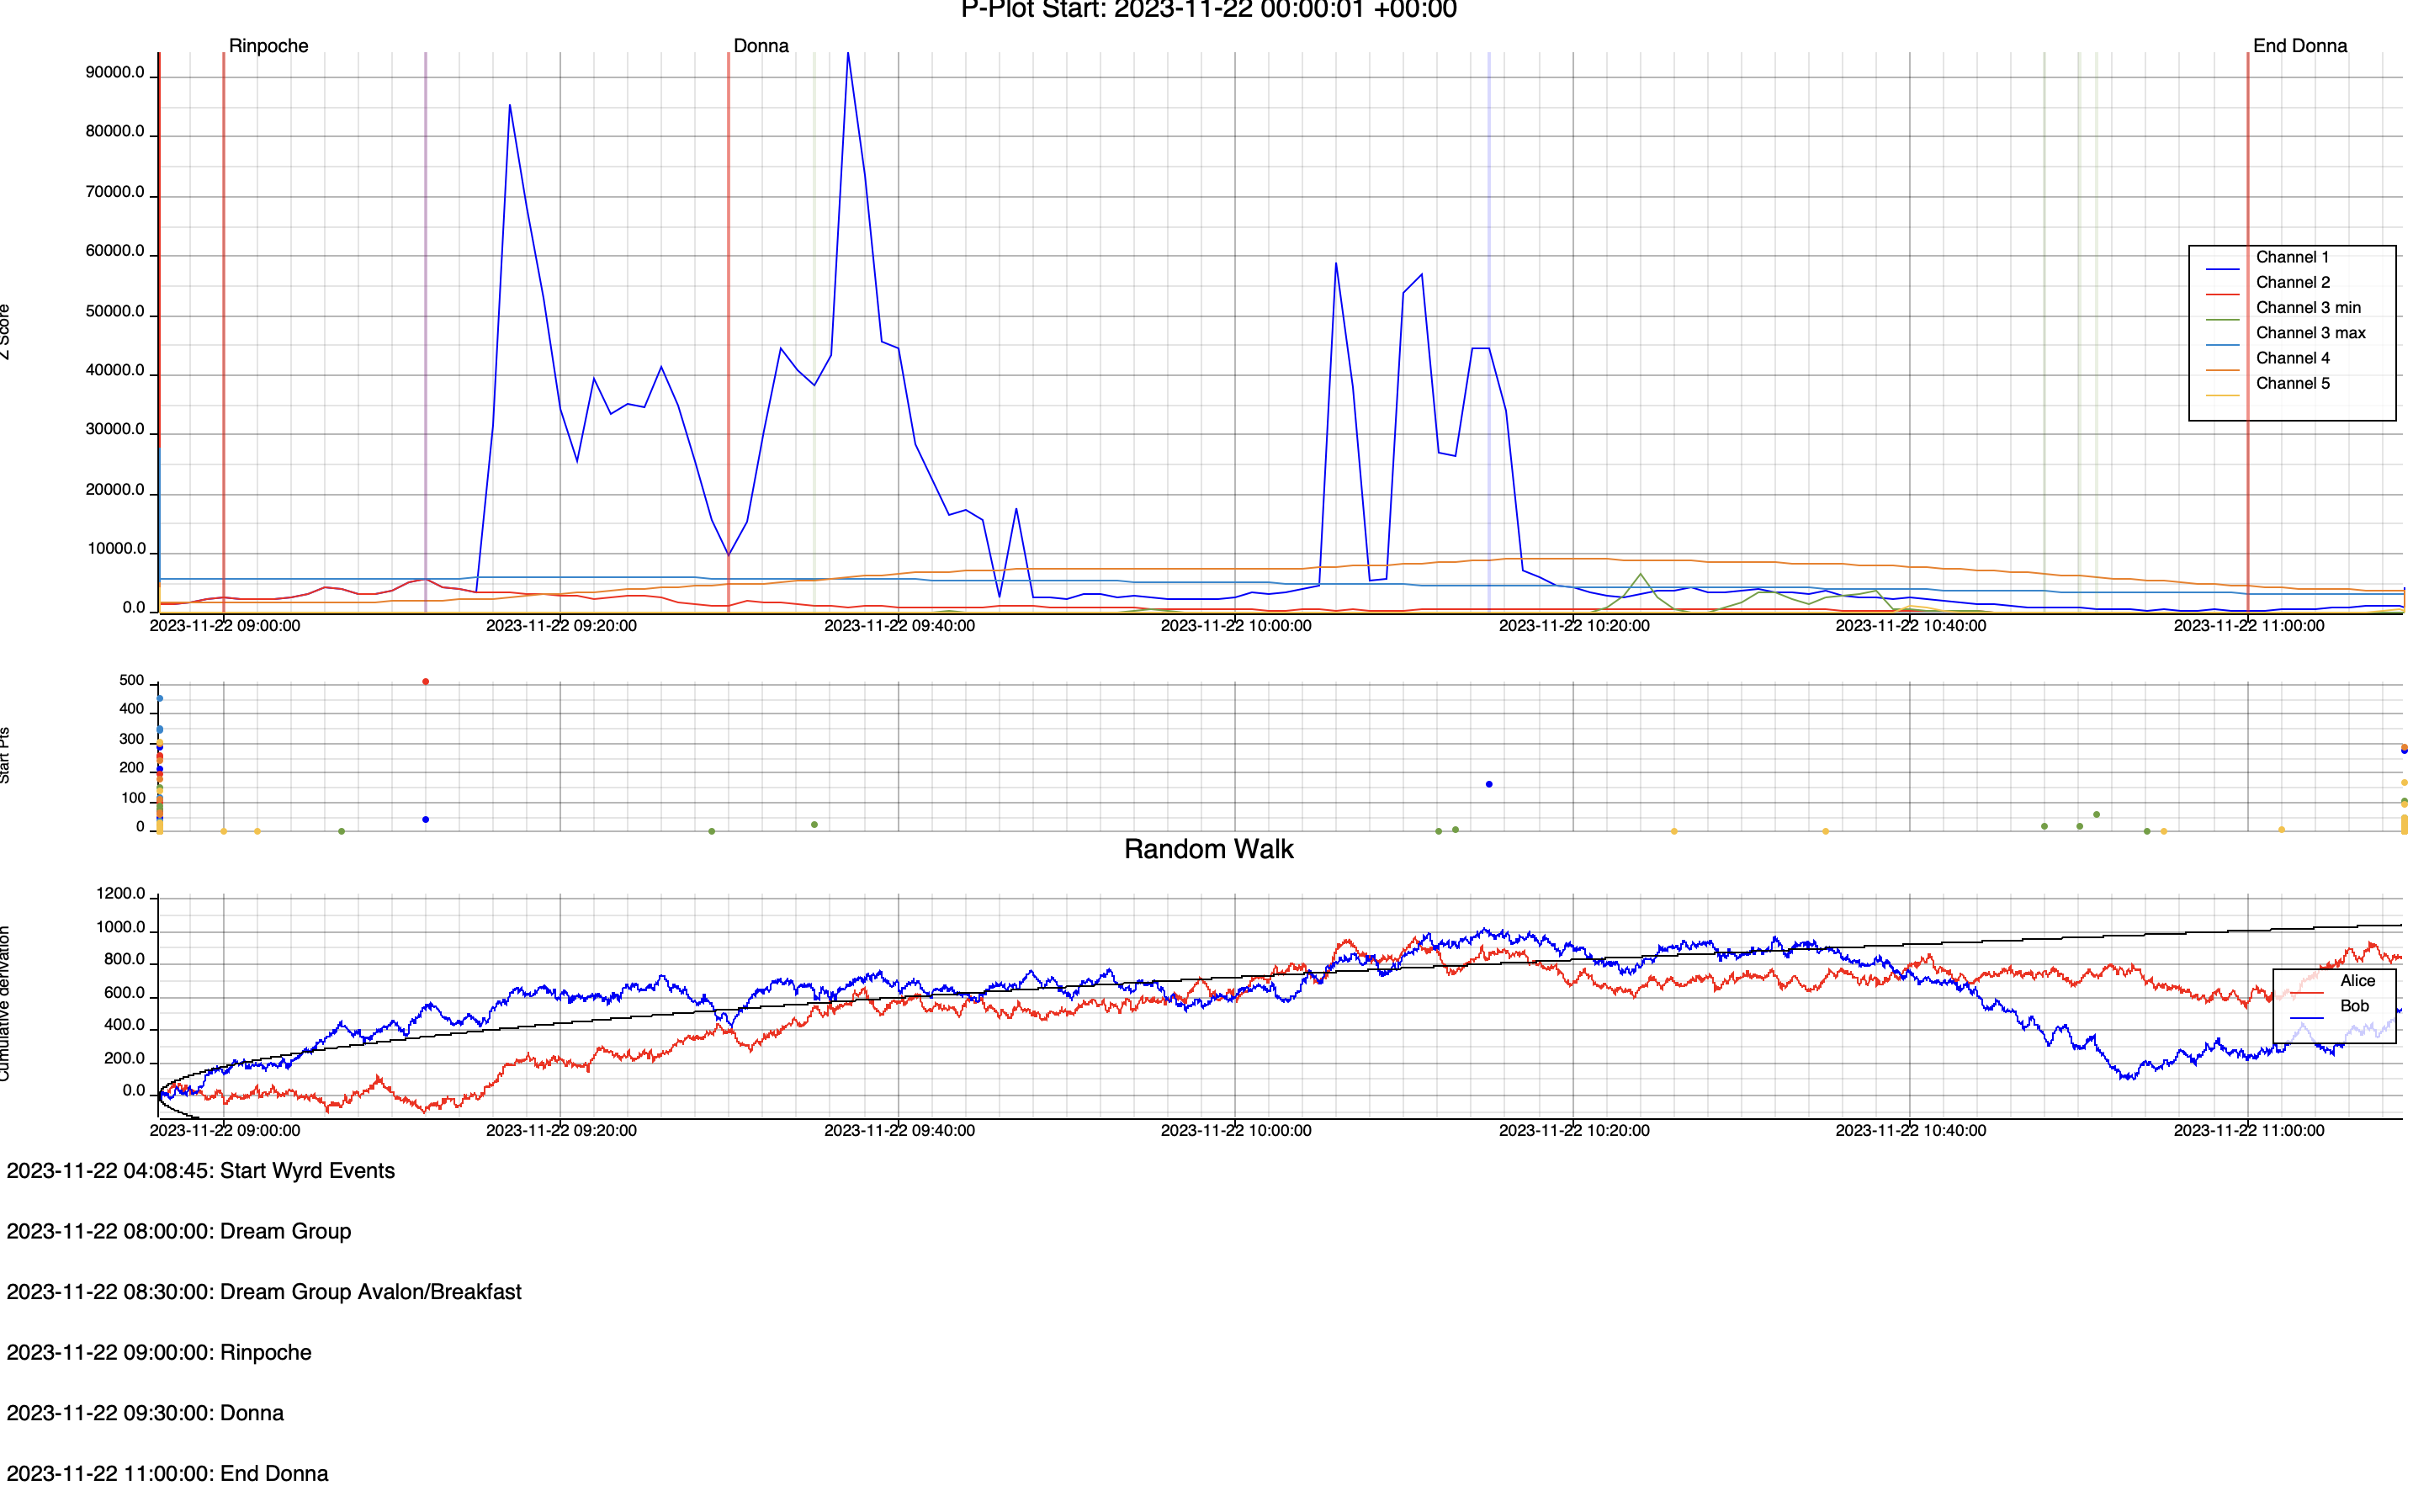
Parallel Sessions
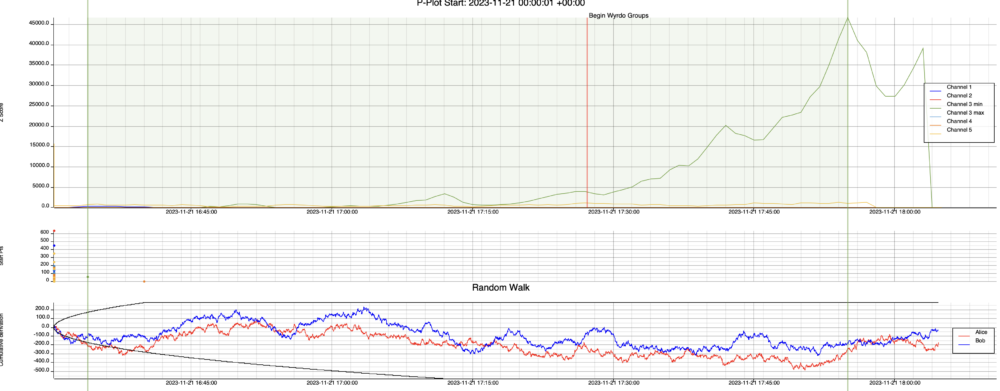
On some days we split up into parallel sessions to enable us to cover more topics than if we did everything sequentially. The peak in the chart happened towards the end of one of those sessions on Tuesday 21st and could have been created by one (or more) of the five sessions happening at that time. It shows that a smaller group can also have a bigger impact. The likelihood of this peak occurring by chance was 1 in 45,000.
Remote Perception Sessions
On Day 3 we always conduct a remote perception experience. Everyone partners up, one half of the group goes to the woods for a forest bathing experience and afterwards attempts to send an image telepathically to their partner who is back in the conference room. The partner has had a small talk about remote perception and received some tips for receiving effectively. The receiving partners are asked to try and pick up what their partner is sending them about 30 minutes before their partner has even decided what the image will be that they will send. (During the Princeton experiments, participants proved to be slightly more effective doing it this way – outside of linear time.)
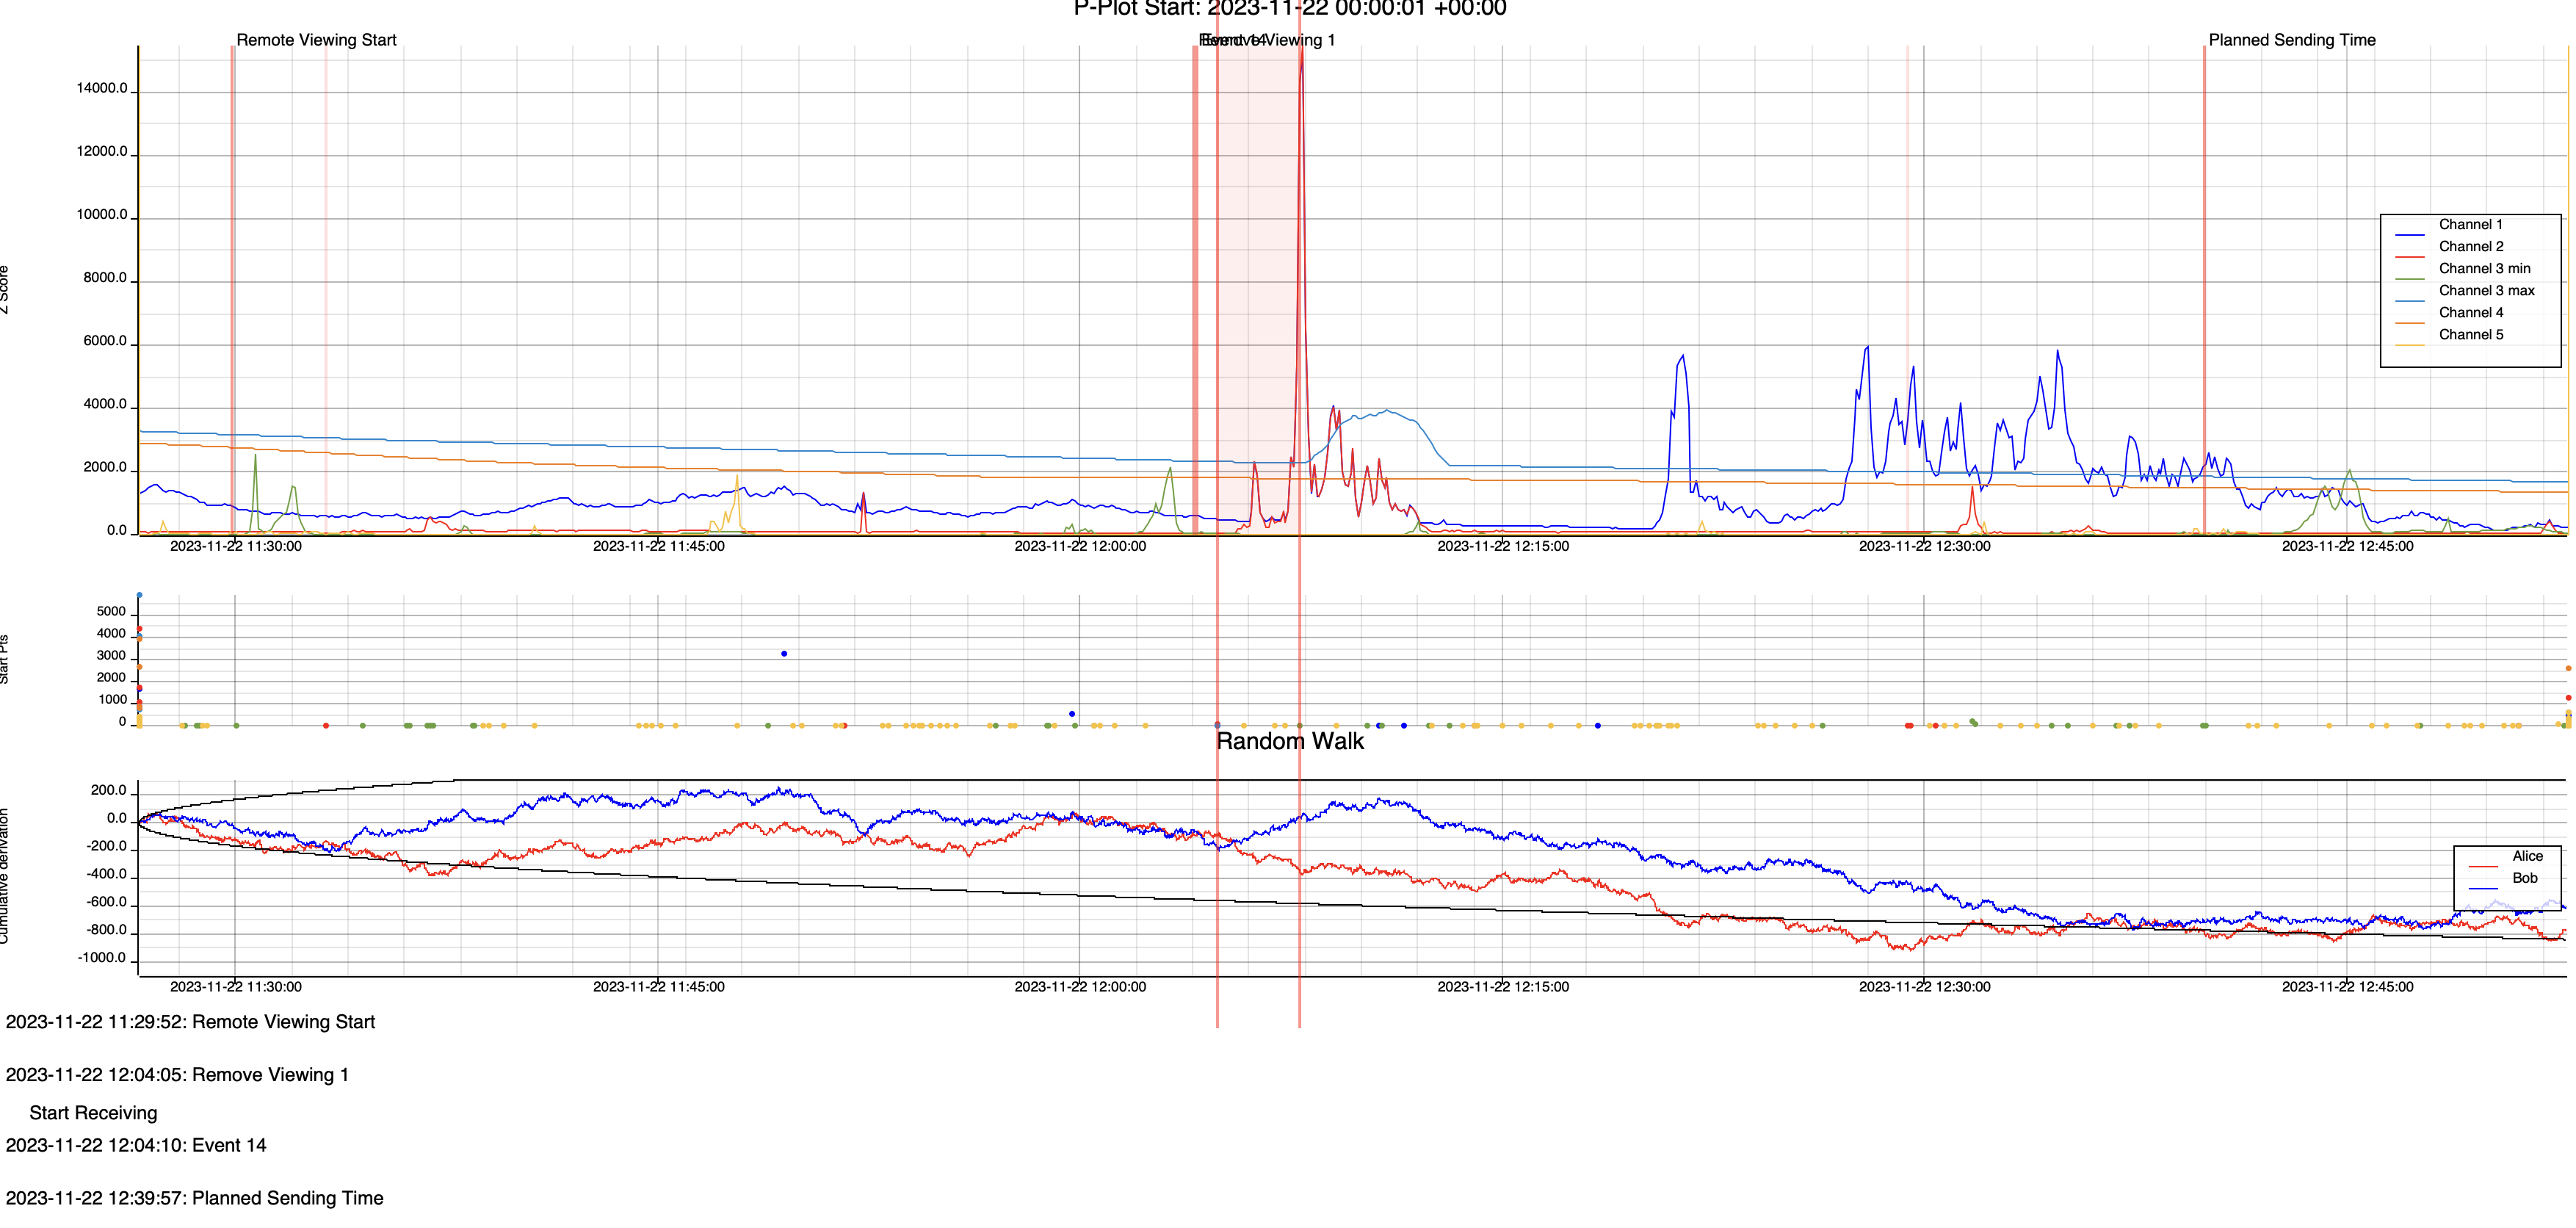
This chart below shows the window within which the sending and receiving took place. The peak is at the time of the sending, about 35 minutes after the receivers had tuned in to pick up what was being sent. This illustrates another interesting feature of the Wyrdoscope software. The algorithm in the software looks for the most natural starting point for an event based on the highest peak that it identifies. In this case it found the peak first, around the time that the senders were sending, and then calculated the expected starting point to be 35 minutes before that point – just when the receivers were tuning in to receive. The likelihood of this peak occurring by chance was 1 in 2,500.
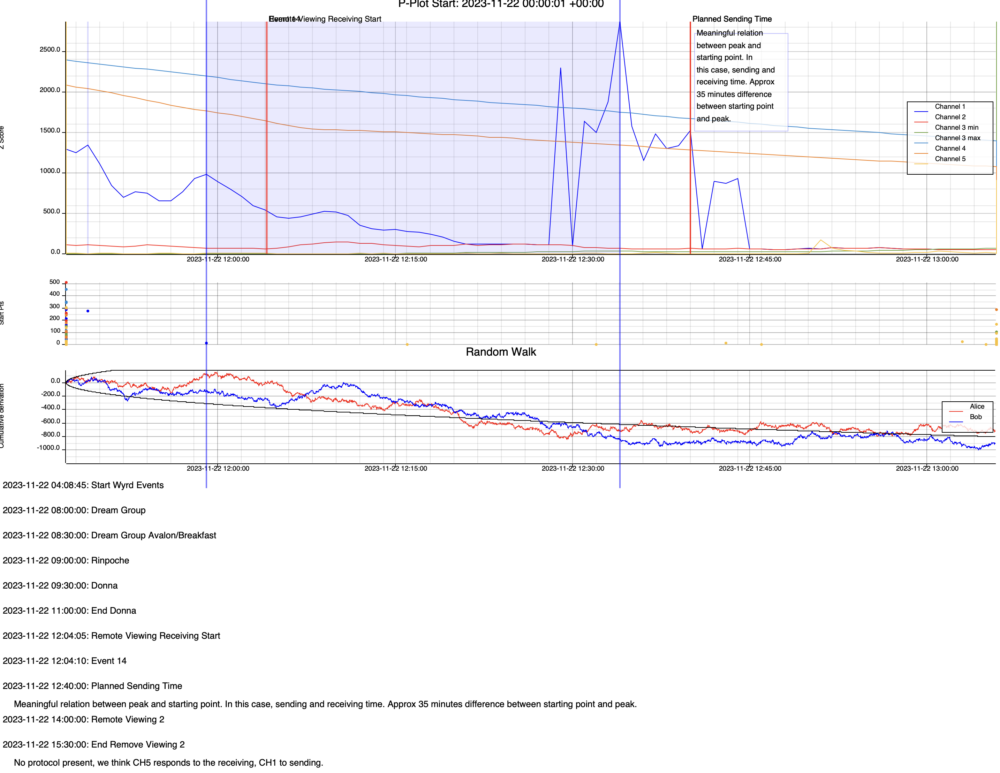
Below is the remote viewing session with the higher resolution using another calculation method. Here we see a high peak on channel 2 a few minutes after start of the receiving session – 30 minutes before the images were sent. The likelihood of this occurring by chance is 1 in 14,000.
Things that go bump in the night
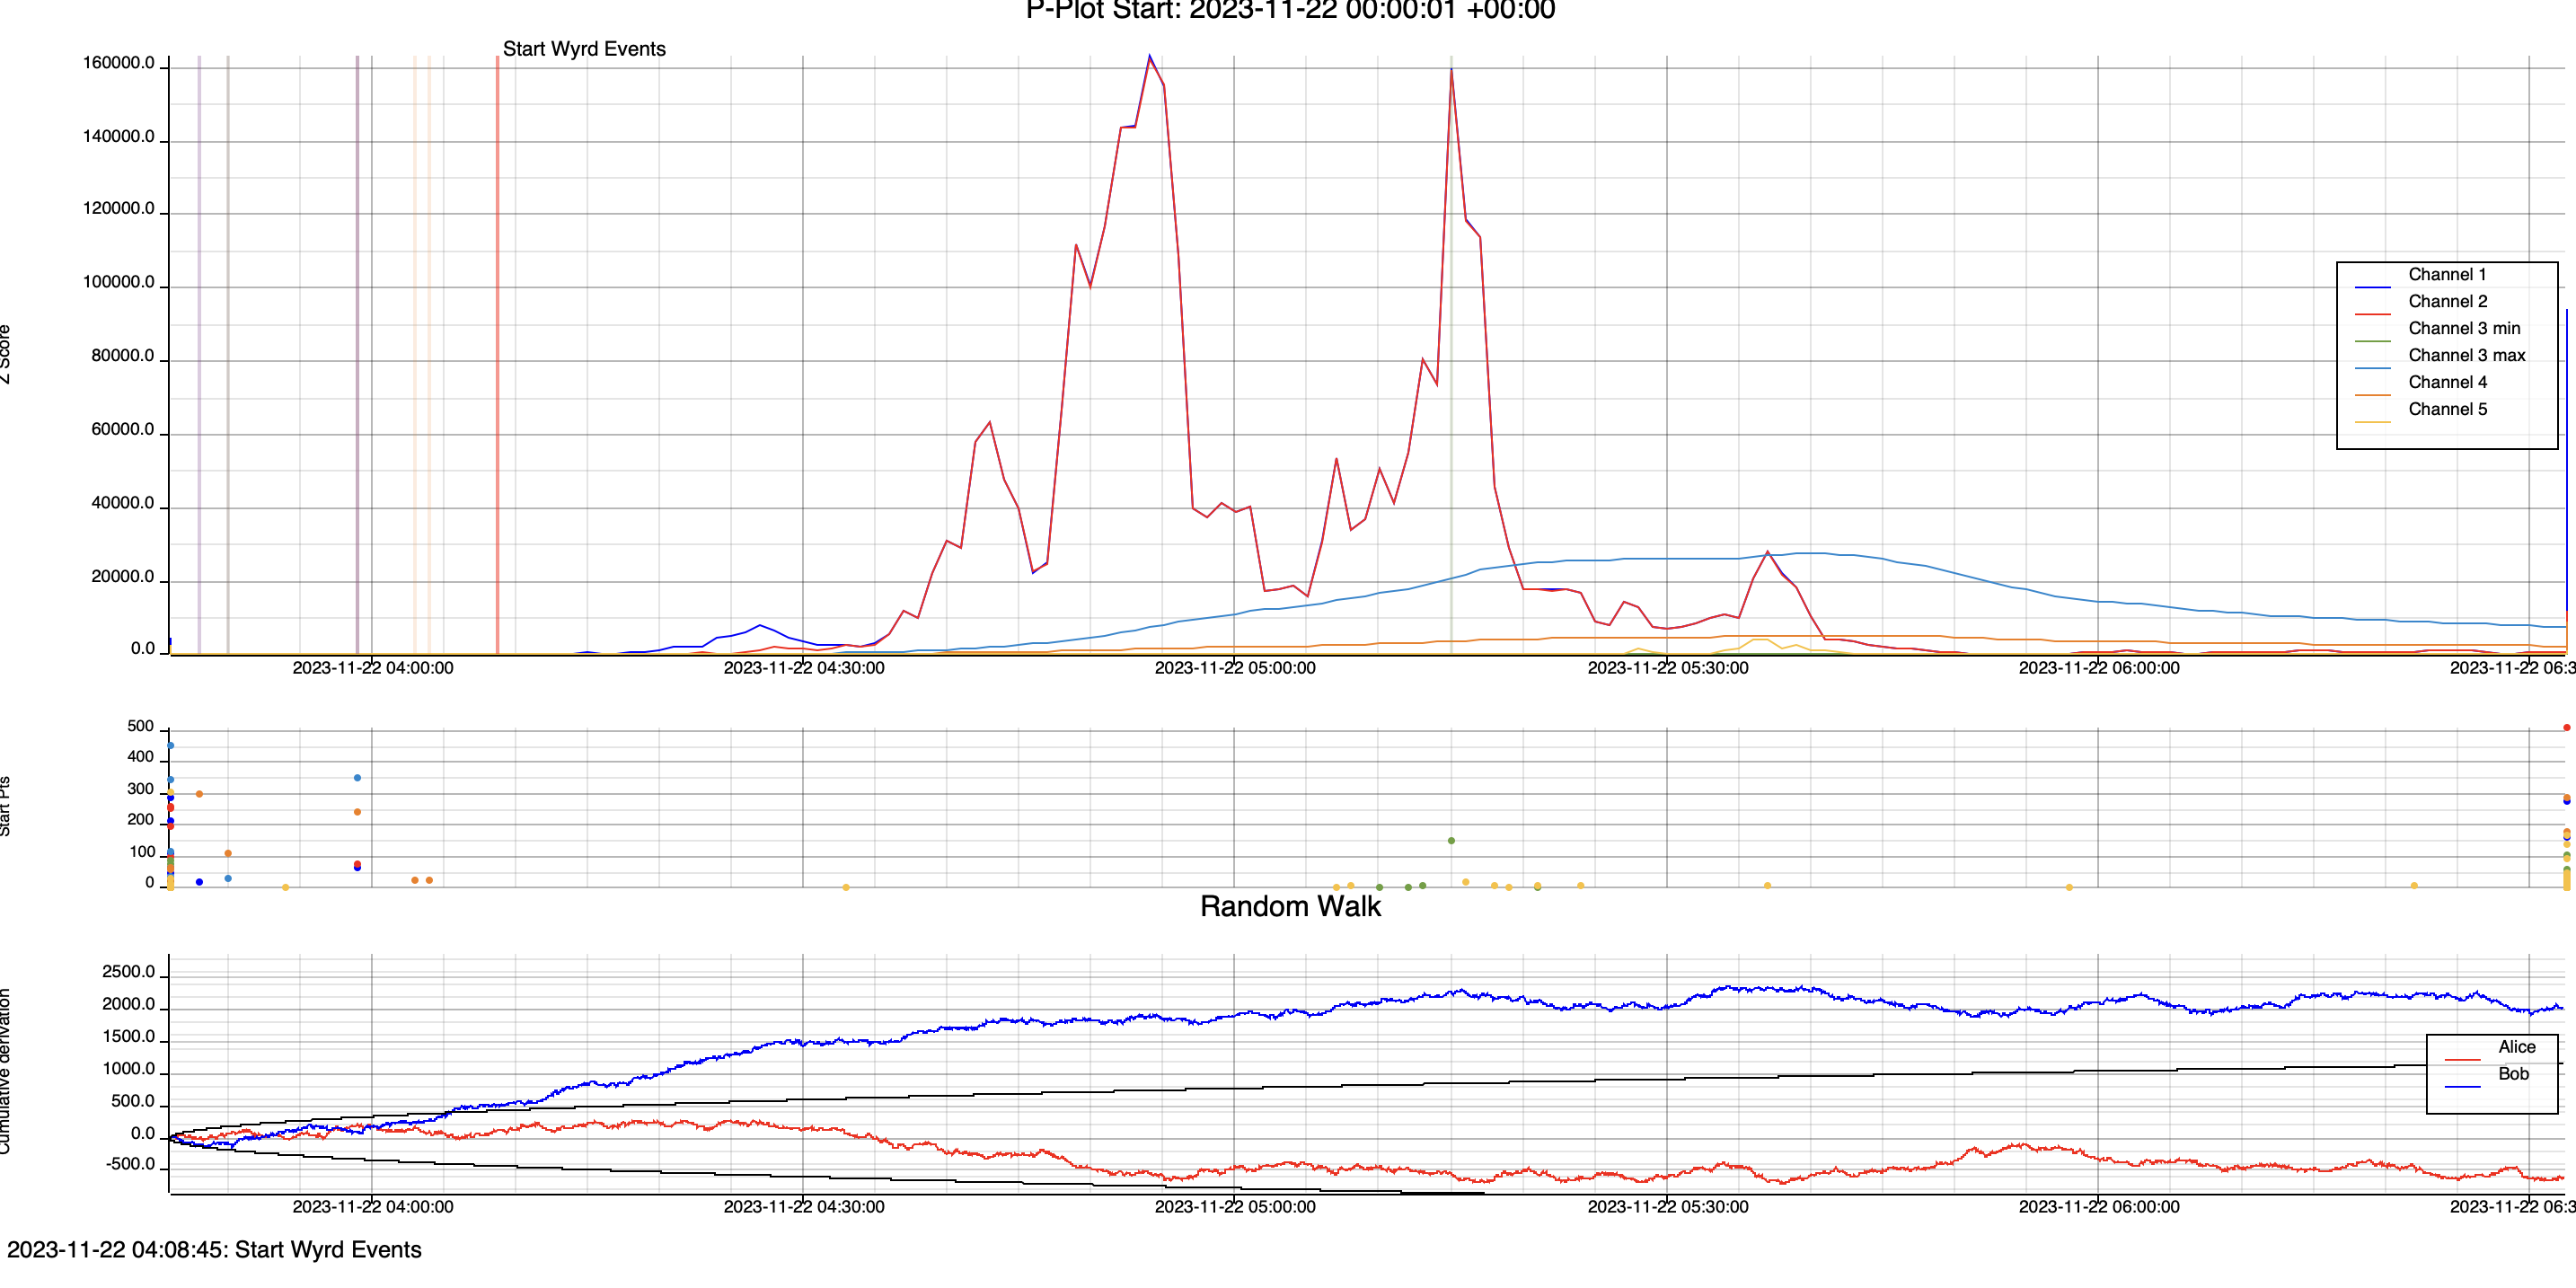
One night when the Wyrdoscope was running we picked up some significant anomalies with peaks with a likelihood of occurring by chance of 1 in 180,000. Multiple channels continued to run high until about 10:30 the next day.
Fire Temple Experience
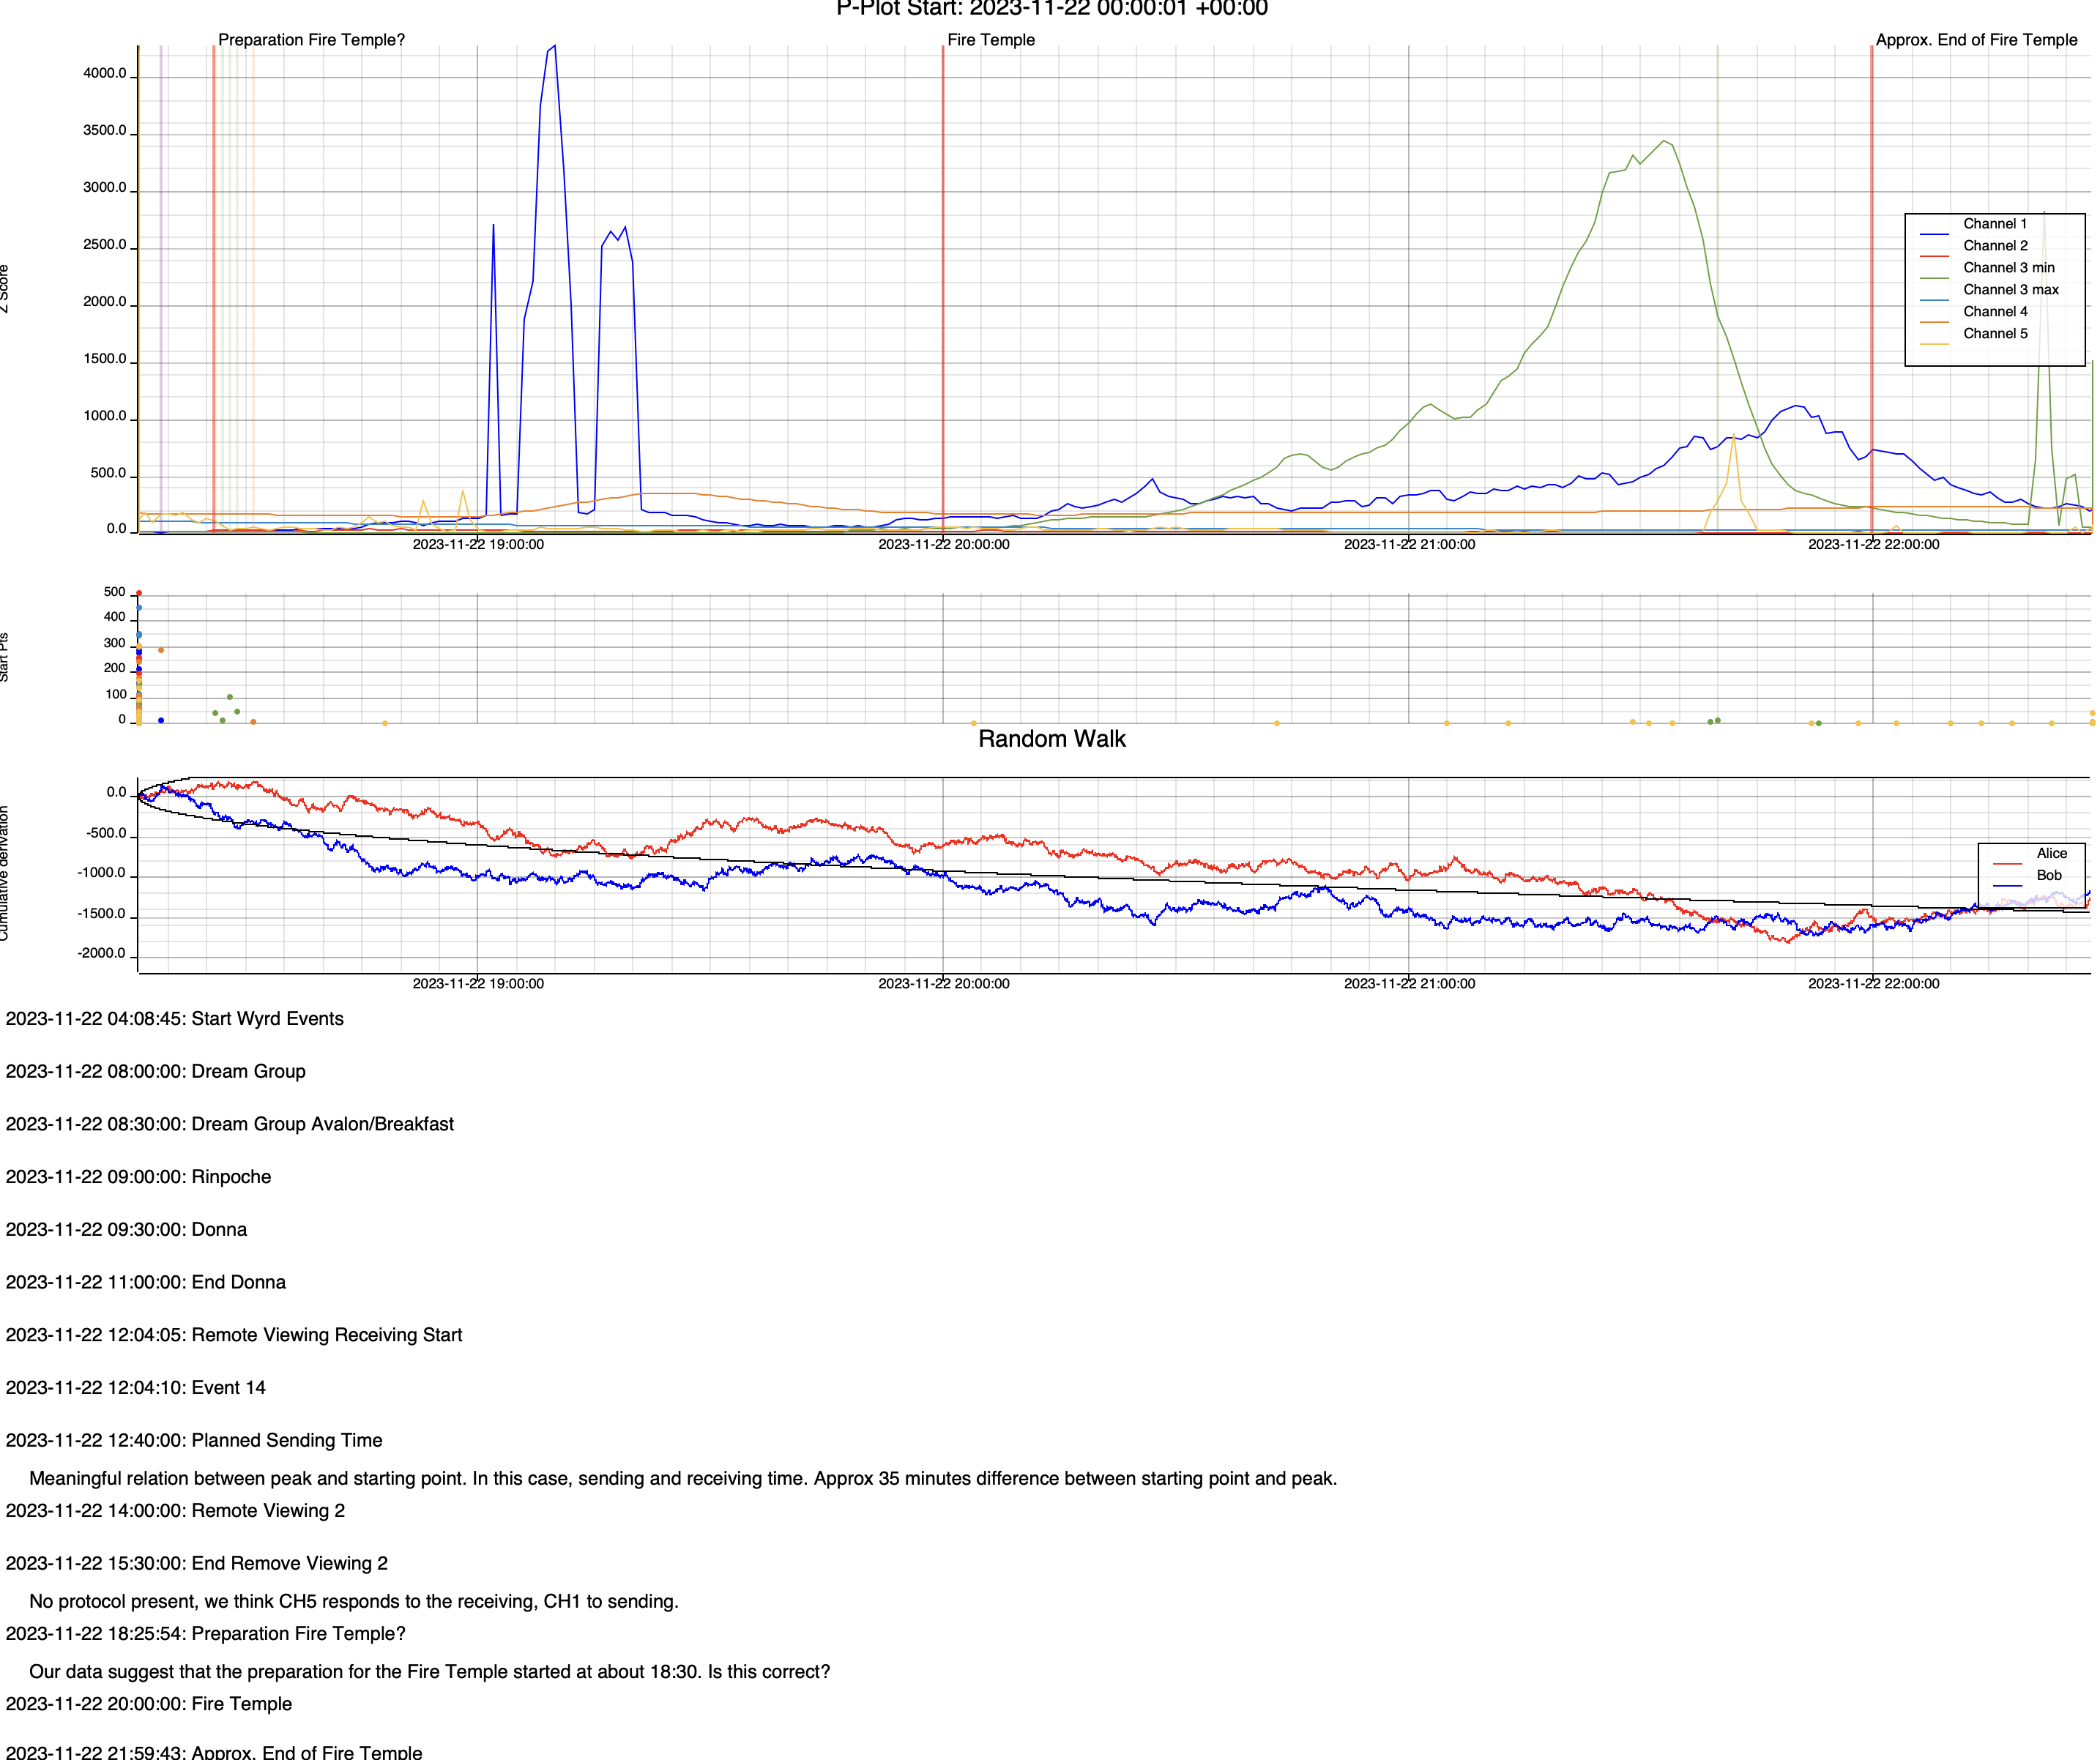
During the last evening we gathered up at the Fire Temple with a blazing log fire at the centre, music, drums and hot cacao. This moment was captured on the Wyrdoscope below (see the green line), with a likelihood of this peak occurring by chance was 1 in 180,000.
